Golden Signals Detect Failures Before Infrastructure Ever Will
A controlled experiment comparing Golden Signal alerts with database and instance checks to see which detects user impact first.
Introduction
In most production incidents, the first question is not what failed, but who noticed first. There are several possibilities:
- Was it the platform?
- Was it an alert?
- Or was it the client? (This is a more general question than we imagine.)
This post documents a controlled experiment that answers a specific question:
Do Golden Signals detect user impact earlier than infrastructure or instance-level checks?
The result is measured, repeatable, and visible across dashboards and alerts. The full code is available on GitHub for experimentation. ❤️
Why infrastructure signals lag by design
Infrastructure checks answer questions like:
- Is the instance reachable?
- Is the container running?
- Is the database process alive?
- And much more, in my personal experience.
These signals are useful, but they are indirect.
They do not answer:
- Are requests succeeding?
- Are users waiting longer?
- Are errors increasing?
Golden Signals—traffic, errors, latency, and saturation—are measured at the service boundary. They represent what users experience, not what components report about themselves.
This difference matters when reliability is evaluated from the user’s point of view.
Experiment setup
To make the comparison fair and repeatable, the entire system was built using Docker.
Components:
- API service: Handles database reads and writes under steady load and exposes Golden Signal metrics.
- PostgreSQL database.
- Load generator (k6): Constant arrival-rate traffic.
- Prometheus.
- Grafana.
- Alertmanager.
- Simulated instance-check monitor: A small service that polls database reachability and only reports failure after sustained downtime. This intentionally models how real infrastructure checks behave.
Key idea
Instance-level checks are rarely instantaneous in production. They typically fail after sustained issues, not at the first sign of user impact.
The simulated monitor reflects that reality.
Architecture (simplified)
Load Generator (k6)
        |
        v
+------------------+
|   API Service    |
|------------------|
| Errors / Latency |----> Prometheus ----> Grafana
| Traffic / Satur. |
+------------------+
        |
        v
   PostgreSQL
        |
        v
+---------------------------+
| Instance Check Monitor    |
| (delayed detection logic) |
+---------------------------+
Failure injection
The experiment is intentionally simple:
- Steady traffic is applied to the API.
- The database is stopped.
- No manual intervention is performed.
- Alerts and dashboards are observed.
All scrape intervals, evaluation windows, and alert durations are fixed.
What fired first (measured data)
From a representative run:
| Alert | Layer | Fired at (UTC) |
|---|---|---|
GSHigh5xxPercentage | Golden Signals | 11:02:57 |
DBUnreachableFromExporter | Database signal | 11:02:57 |
GSHighLatencyP95 | Golden Signals | 11:03:42 |
InstanceCheckFailedSimulated | Instance | 11:04:02 |
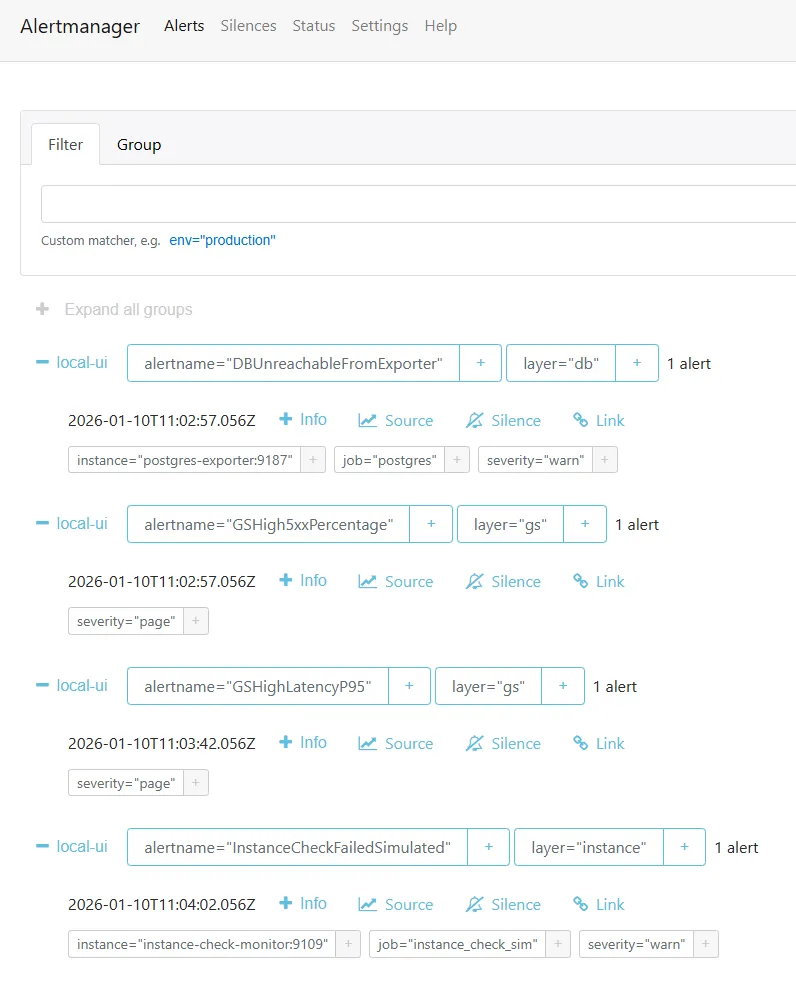
Evidence from Alertmanager.
Observations
- User-visible errors were detected before instance checks.
- Database reachability changed early but did not represent full user impact.
- Instance-level detection arrived last, by design.
- The ordering was consistent across multiple runs.
This mirrors what commonly happens in real production incidents.
What the dashboards show
Golden Signals dashboard
- Request rate remains stable.
- Error rate increases immediately.
- p95 latency follows as retries and timeouts accumulate.
Database and infrastructure dashboard
- Database reachability (
pg_up) flips quickly. - The instance check remains healthy until sustained failure.
- The instance check flips after Golden Signals have already indicated impact.
The separation is visible without inspecting logs.
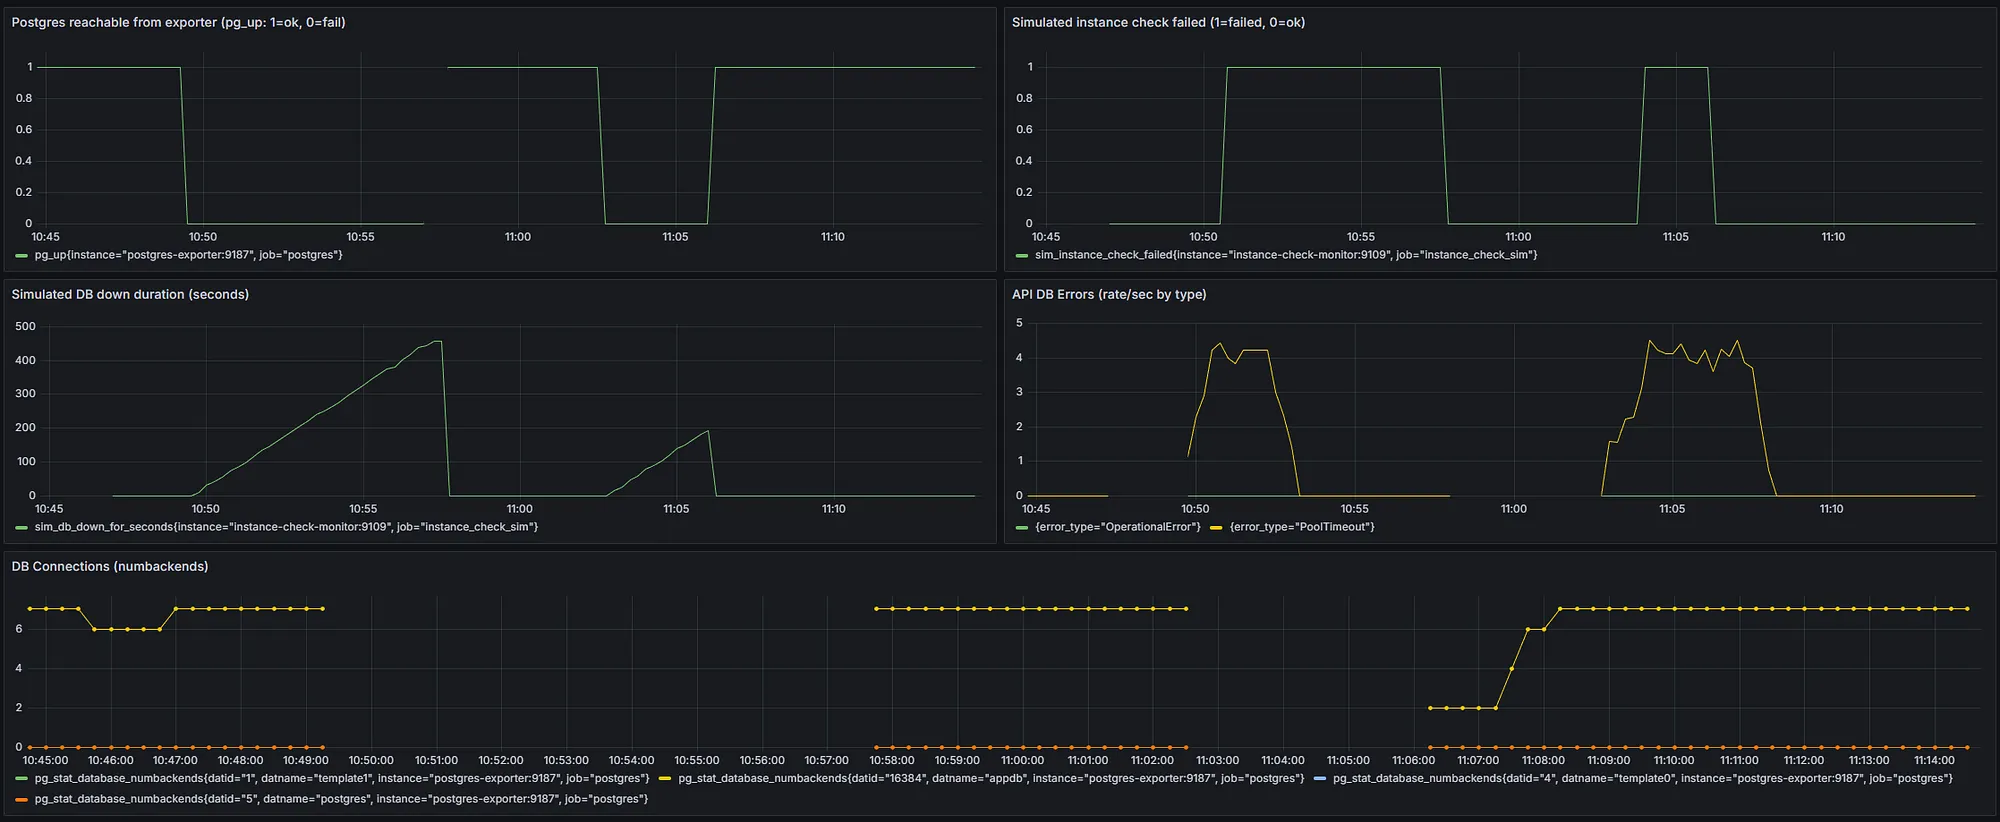
Screen capture from the experiment timeline.
Why alert delays exist in production systems
A common question is why alerts are not immediate in real environments.
The short answer
In production, alert delays are not simulated waits. They emerge naturally from how signals are measured, aggregated, and evaluated.
The production reality
Alerting systems do not trigger on individual events. They rely on:
- Scrape intervals (for example, every 15 seconds).
- Aggregation windows (for example, 1–5 minutes).
- Evaluation cycles.
- For-duration conditions (“breach sustained for N minutes”).
This delay is intentional.
Why gauges are the correct abstraction
Golden Signals are modeled as stateful signals, typically represented as gauges.
Examples include:
- Error rate.
- Latency percentiles.
- Saturation.
- Queue depth.
A gauge answers:
What is the system’s state right now?
This enables alert rules such as:
error_rate > 5% for 3 minutesThe system is not hiding failures. It is waiting for signal confidence.
Alerts are delayed not because systems are slow, but because signals need time to stabilize.
How this maps to the experiment
In the demo, the instance-check delay is explicit so the ordering is visible. In production, the same delay appears implicitly due to aggregation windows and conservative evaluation.
The principle is the same.
Why not all API failures should alert
Another common concern is that APIs fail occasionally, even in healthy systems.
In real systems:
- Some errors are expected.
- Some requests are retried.
- Some APIs are best-effort.
- Some failures are invisible to users.
So “an API failed” is not a meaningful alert signal.
What not to alert on
- Raw error counts.
- Single 5xx responses.
- Individual endpoint failures.
These lead to noise because they ignore:
- Traffic volume.
- Retries.
- Non-critical paths.
- Partial degradation.
What to alert on instead
-
Error rate, not error count
This normalizes for traffic and reflects impact:
error_rate = errors / total_requests. -
Latency percentiles, not averages
Users experience tail latency, not means:
p95_latency > SLO. -
Golden Signals at the user boundary
Alerts attach only to user-facing SLOs, not internal or best-effort endpoints.
As I always tell my team:
Reliability engineering is not about preventing failure. It is about detecting when failure exceeds what the system and users can tolerate.
Mapping this back to the demo
The demo uses a simplified service. Real systems go further by classifying endpoints as:
- User-facing.
- Internal.
- Best-effort.
Golden Signal alerts attach only to user-facing paths. That is a sign of maturity, not a limitation.
What changed because of this experiment
The takeaway is not to remove infrastructure monitoring.
It is to order signals correctly:
- Golden Signals first.
- Database and dependency signals as confirmation.
- Instance and infrastructure checks last.
Infrastructure health answers “Is the system alive?”
Golden Signals answer “Is the system working for users?”
Detection should start with the latter.
Closing
Infrastructure metrics tell you whether a system is running. Golden Signals tell you whether it is serving users successfully.
When reliability is measured from the user’s point of view, detection must begin at the service boundary.
Observability is not about reacting faster. It is about reacting only when it matters.
Originally published on Medium on January 10, 2026.