Bridging MCP with Databases: Empowering LLMs for Incident Insights—POC
A proof of concept connecting LLMs to PostgreSQL through MCP so incident analysis can combine structured metrics with human context.

Illustration
💡 Why This Project?
Modern incident work needs two different strengths:
- Structured data from a database (numbers, metrics, timelines).
- Unstructured language from humans (incident notes, RCAs, chat).
LLMs are good at language but unreliable for calculations. MCP (Model Context Protocol) lets an agent call out to a database so numbers come from SQL while language comes from the model. This project wires MCP → Postgres and keeps that separation clear.
🖧 Design
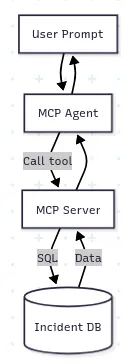
Basic idea of MCP on PostgreSQL implementation
⚙️ Implementation Notes
- Postgres bootstraps idempotently (extensions, schemas, views, roles).
- Tools map to stable SQL; the agent never “calculates” numbers—only explains them.
- How are the tools exposed?
$ curl -s http://localhost:8080/health | jq
{
 "status": "ok",
 "mcp_url": "http://mcp_server:8000/mcp/",
 "tools": [
 "db_list_tables",
 "db_server_info",
 "db_uptime",
 "incident_activity_by_hour",
 "incident_clients_of",
 "incident_duration_hist",
 "incident_env_mix",
 "incident_followups",
 "incident_get",
 "incident_kpis_30d",
 "incident_recent",
 "incident_recent_followups",
 "incident_search",
 "incident_search_snippets",
 "incident_sla_breaches",
 "incident_top_clients",
 "subdept_kpis"
 ],
 "llm_model": "gpt-4o-mini",
 "rates_per_1k": {
 "input": 0.0006,
 "output": 0.0024
 },
 "features": {
 "viz": true,
 "args_samples": false,
 "context_store": true
 }
}- This sample call shows the full response, including token usage and the corresponding cost rates defined in the
.envfiles.
$ curl -s http://localhost:8080/chat -H 'Content-Type: application/json' -d '{"prompt":"Subdepartment KPIs last 30 days"}' | jq
{
 "request_id": "c35acb69-2f6a-40a6-9896-a3be3b0a350d",
 "ts": "2025-09-06T02:21:18.913465",
 "model": "gpt-4o-mini",
 "message": "Here are the subdepartment KPIs for the last 30 days:\n\n1. **CDN Edge**\n - Incidents: 1\n - Average Total Time (min): 580\n - Average Detection Time (min): 8\n - Average Triage Time (min): 324\n - Average Mitigation Time (min): 153\n\n2. **Growth & Notifications**\n - Incidents: 1\n - Average Total Time (min): 646\n - Average Detection Time (min): 80\n - Average Triage Time (min): 20\n - Average Mitigation Time (min): 435\n\n3. **Metadata Ingestion**\n - Incidents: 1\n - Average Total Time (min): 439\n - Average Detection Time (min): 82\n - Average Triage Time (min): 80\n - Average Mitigation Time (min): 140\n\n4. **Playback**\n - Incidents: 1\n - Average Total Time (min): 610\n - Average Detection Time (min): 22\n - Average Triage Time (min): 169\n - Average Mitigation Time (min): 341\n\n5. **SRE**\n - Incidents: 1\n - Average Total Time (min): 638\n - Average Detection Time (min): 85\n - Average Triage Time (min): 71\n - Average Mitigation Time (min): 298\n\n6. **User Profiles**\n - Incidents: 1\n - Average Total Time (min): 676\n - Average Detection Time (min): 125\n - Average Triage Time (min): 180\n - Average Mitigation Time (min): 167\n\nIf you need further details or insights, feel free to ask!",
 "finish_reason": "stop",
 "usage": {
 "prompt_tokens": 2963,
 "completion_tokens": 406,
 "total_tokens": 3369,
 "cost": {
 "input_usd": 0.001778,
 "output_usd": 0.000974,
 "total_usd": 0.002752,
 "rates_per_1k": {
 "input": 0.0006,
 "output": 0.0024
 }
 }
 },
 "tools_trace": [
 {
 "tool": "subdept_kpis",
 "ok": true,
 "error": null,
 "duration_ms": 10,
 "args_len": 12,
 "resp_len": 1522
 }
 ],
 "viz_vegalite": {
 "$schema": "https://vega.github.io/schema/vega-lite/v5.json",
 "description": "Tool calls duration",
 "data": {
 "values": [
 {
 "tool": "subdept_kpis",
 "ok": true,
 "error": null,
 "duration_ms": 10,
 "args_len": 12,
 "resp_len": 1522
 }
 ]
 },
 "mark": {
 "type": "bar"
 },
 "encoding": {
 "y": {
 "field": "tool",
 "type": "nominal",
 "sort": "-x",
 "title": "Tool"
 },
 "x": {
 "field": "duration_ms",
 "type": "quantitative",
 "title": "Duration (ms)"
 },
 "color": {
 "field": "ok",
 "type": "nominal",
 "title": "Success"
 },
 "tooltip": [
 {
 "field": "tool",
 "title": "Tool"
 },
 {
 "field": "duration_ms",
 "title": "Duration (ms)"
 },
 {
 "field": "args_len",
 "title": "Args (chars)"
 },
 {
 "field": "resp_len",
 "title": "Resp (chars)"
 },
 {
 "field": "error",
 "title": "Error"
 }
 ]
 }
 },
 "thread_id": "8c15771f-46ff-4f70-8a2d-1c3fe1897cd5",
 "turn_index": 0
}
🛠️ New: Session Management (in Testing)
Test plan (current)
- Isolation: two sessions ask the same question; ensure no cross-leak in summaries or costs.
- Determinism of numbers: follow-up paraphrases must hit tools again (no cached arithmetic).
- TTL expiry: after TTL, the same session ID should behave like new (no residual memory).
- Budget guards: force token and time limits; verify graceful truncation + explicit notices.
- Concurrency: N parallel sessions against Postgres; check pool starvation and tool timeouts.
- Audit: every answer traces to (tool, SQL view, timestamp); logs are complete and immutable.
- Privacy: ensure no identity is stored in session summaries; obscure on capture, not on display.
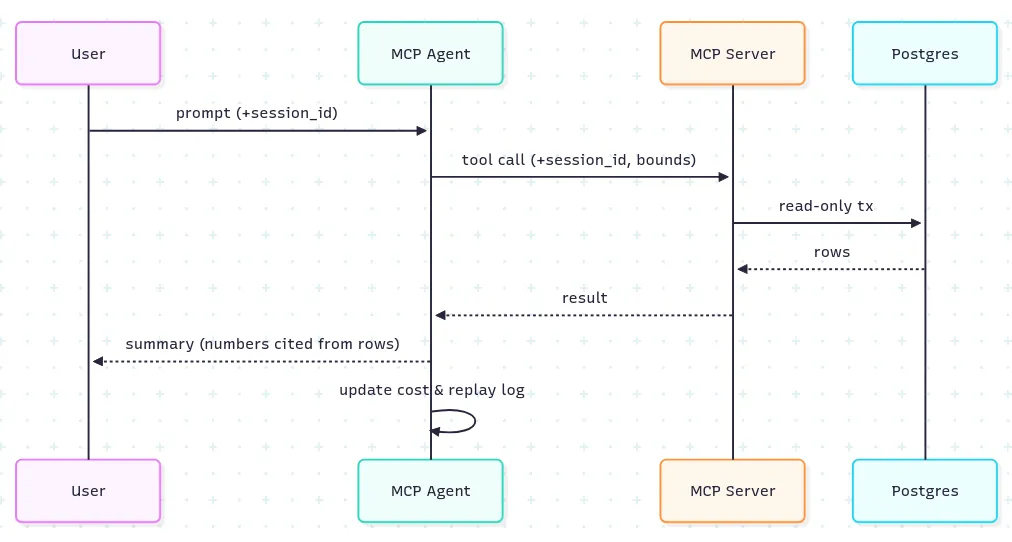
Session flow (currently in testing)
Example of the follow-up pattern:
$ curl -s http://localhost:8080/chat -H 'Content-Type: application/json' -d '{"prompt":"Subdepartment KPIs last 30 days"}' | jq '{message, thread_id}'
{
 "message": "Here are the subdepartment KPIs for the last 30 days:\n\n1. **CDN Edge**\n - Incidents: 1\n - Average Total Time (min): 580\n - Average Detection Time (min): 8\n - Average Triage Time (min): 324\n - Average Mitigation Time (min): 153\n\n2. **Growth & Notifications**\n - Incidents: 1\n - Average Total Time (min): 646\n - Average Detection Time (min): 80\n - Average Triage Time (min): 20\n - Average Mitigation Time (min): 435\n\n3. **Metadata Ingestion**\n - Incidents: 1\n - Average Total Time (min): 439\n - Average Detection Time (min): 82\n - Average Triage Time (min): 80\n - Average Mitigation Time (min): 140\n\n4. **Playback**\n - Incidents: 1\n - Average Total Time (min): 610\n - Average Detection Time (min): 22\n - Average Triage Time (min): 169\n - Average Mitigation Time (min): 341\n\n5. **SRE**\n - Incidents: 1\n - Average Total Time (min): 638\n - Average Detection Time (min): 85\n - Average Triage Time (min): 71\n - Average Mitigation Time (min): 298\n\n6. **User Profiles**\n - Incidents: 1\n - Average Total Time (min): 676\n - Average Detection Time (min): 125\n - Average Triage Time (min): 180\n - Average Mitigation Time (min): 167\n\nIf you need more details or specific information, feel free to ask!",
 "thread_id": "ceb6686b-05ad-4732-9091-3452510b31c6"
}

-- Extending chat with thread_id

$ curl -s http://localhost:8080/chat -H 'Content-Type: application/json' -d '{"prompt":"Concentrate on Average Detection Time only","thread_id":"ceb6686b-05ad-4732-9091-3452510b31c6"}' | jq -r ".message"
Here are the Average Detection Times for each subdepartment over the last 30 days:

1. **CDN Edge**: 8 minutes
2. **Growth & Notifications**: 80 minutes
3. **Metadata Ingestion**: 82 minutes
4. **Playback**: 22 minutes
5. **SRE**: 85 minutes
6. **User Profiles**: 125 minutes

If you need further analysis or details, let me know!
🧰 Technologies Used
 | Area | Tools / Tech
 | ----------------------- | -------------------------------------------
 | Core protocol | MCP (Model Context Protocol)
 | Language & runtime | Python 3.12, Bash, SQL (Postgres dialect)
 | Web/API layer | Uvicorn (ASGI) + FastAPI
 | Database | PostgreSQL 16+
 | Containers | Docker, Docker Compose
 | LLMs | OpenAI GPT-4o-mini (primary)
 | Cost tracking (testing) | Token/call counters (per session)
 | Client utilities | curl, jq
 | Guardrails | Argument bounds, regex-based secret redaction
 per-session budgets |
 | Auditability | Append-only replay log (JSONL)
💪 Key Strengths
- Language vs. numbers split: LLM explains; DB computes.
- Traceability: every number is sourced from a view/tool.
- Safety: session isolation, budgets, and redaction reduce surprises.
📚 Lessons Learned
- LLMs drift on arithmetic; always route math to SQL.
- Keep summaries short; re-query for fresh numbers on follow-ups.
- Session TTLs and budgets help avoid silent state creep.
🏁 Closing Note
MCP + Postgres gives a clean boundary: database for truth, LLM for language. Session management adds reliability at the conversation layer—useful for incident reviews where follow-ups are common and audits matter.
👨💻 Status
At the time of publication, this was still under development, so I did not yet recommend trying it yourself. I planned to publish a YouTube video around mid-October 2025.
Originally published on Medium on September 6, 2025.